In these sections we examine the different ways in which rock materials respond to stress.
The simplest response is one in which the finite strain is proportional to the applied stress. In this case, if the stress decreases, the strain decreases too, so we say the strain is recoverable, or elastic. All rocks respond elastically to some degree, and this type of strain is very important for understanding seismic waves. However, natural elastic strains in rocks are very small and are not preserved when rocks are exposed at the surface and stress is removed.
Most rocks near the Earth's surface, subjected to increasing differential stress, will eventually fail by brittle fracture. When failure occurs, the strength of the rock falls to zero across the plane of fracture. This is called loss of cohesion. The condition for failure can be represented on the Mohr diagram for stress by a failure envelope. Several different formulas for the failure envelope have been proposed.
Coulomb failure envelope VDPM 0615
Mohr failure envelope VDPM 0618
Byerlee's law for movement on pre-existing fractures VDPM 0624
Notice how under Byerlee's law conditions the failure envelope does not extend into the tensile field on the left of the diagram. This means that the rock cannot sustain any tensile stress - it has no cohesion.
Many brittle fractures occur as discrete planes, but in some rock units there are multiple anastomosing fractures, that create the appearance of continuous deformation. Such a deformed unit may appear ductile at outcrop scale but is brittle at microscopic scale. This type of process is called cataclastic flow.
Permanent (non-recoverable) deformation that is not associated with a loss of cohesion is variously termed continuous deformation, flow, ductile flow or creep.
In creep, the strain rate, not the finite strain, that is a function of the applied stress.
The exact form of the relationship between strain rate and stress is called the constitutive law for the material.
We may imagine a material which is rigid or elastic at low stress but which starts to flow easily when a fixed yield stress is reached. This is described as ideal plastic or Von Mises behaviour. The stress within the material can never exceed the yield stress because the material flows at whatever speed is necessary to get out of the way of the applied stress. Obviously this is an idealized model for flow, but it approximates some types of materials, especially if the strain rate is kept low. A failure envelope for an ideal plastic material looks like this on a Mohr diagram>
Some geologic materials undergo a transition from brittle to plastic behaviour as depth increases. The failure envelope for such a material appears as in VDPM 06.21a
Many liquids flow as soon as a shear stress is applied, and the rate of shear strain is directly proportional to the applied shear stress. The constant of proportionality is called the viscosity. Some rocks behave in this way, particularly at high temperatures, close to their melting points, though the actual viscosities are very high.
The equation for viscous flow is
![]()
where η is the viscosity
Many minerals do not show Newtonian behaviour. Instead, the apparent viscosity changes with strain rate. Some materials follow what is called a power law relationship.

Under other conditions, it is found that the strain rate is proportional to an exponential function of the stress.
It's possible to calculate bond strengths in crystals from chemical data. In most cases, the strengths indicate that it's impossible, with geologically reasonable stresses, to simultaneously break all the bonds in a crystal, so as to (for example) shear the crystal.
Nevertheless, we see clear evidence for shearing of crystals in deformed rocks.
It turns out that crystal defects - departures from the ideal lattice structure - are critically important in allowing crystals to deform.
Many of the illustrations in this section are from an excellent series of lecture notes posted by M Jessell, P Bons & P Rey 2002 at Microstructures Online http://www.earth.monash.edu.au/Teaching/mscourse/
Point defects include:
Diagram showing types of point defects
 http://www.virtualexplorer.com.au/special/meansvolume/contribs/jessell/
Point defects can move through crystals by diffusion (random motion of atoms). Vacancies are particularly important in allowing diffusion to take place
Animation of vacancy diffusion.
Line defects where there is a non-standard linking of atoms are also known as dislocations.
Diagram of edge dislocation (www.crystalmaker.com)
[Equivalent diagram in VDPM 9.08a ]
Large numbers of dislocations produce a curved crystal lattice VDPM 09.24
This shows up in thin section as undulose extinction [with accessory plate]
 Dislocations in a crystal under TEM
[Similar illustration VDPM 09.05, VDPM 09.09]
The nature of the defect is defined by theBurger's vector b.
Diagram to show circuit that defines Berger's vector
[Equivalent diagram to VDPM 09.08]
To define the Burger's vector, describe a closed loop in an undeformed section of crystal. Then follow a similar loop around the dislocation; the gap between the start and end point is the Burger's vector b.
An edge dislocation has b perpendicular to the dislocation line. It marks the edge of an extra half-plane of atoms.
 A screw dislocation has b parallel to the dislocation line. Atoms are connected in a helix ("spiral staircase") around the screw dislocation.
In practice, a given dislocation can change orientation from parallel to perpendicular to b, and all orientations in between. VDPM 09.06
 Typically, across a twin plane, the structure of a crystal is reflected. (Rotations are also possible). Calcite and plagioclase feldspar are two minerals that typically show abundant twin planes.
Subgrain boundaries are surfaces across which the crystal lattice undergoes a subtle change in orientation.
A subgrain boundary is equivalent to a dislocation wall.
Movie showing subgrain development
They are often visible under crossed polars in grains that show undulose extinction.
Stacking faults are planar sufaces across which unit cells are built ('stacked') in an order that does not match that of the perfect crystal.
Microcracks are important in the initiation of brittle deformation, because their ends are regions of stress concentration that can nucleate faults.
Also known as volume diffusion - crystal changes shape by migration of point defects - particularly vacancies - through the crystal.
Typically Herring Nabarro creep follows a Newtonian or viscous constitutive law, but is also dependent on grain size, so that the viscosity is proportional to the cube of the grain size.
Also known as grain boundary diffusion
Crystal changes shape by migration of atoms along grain boundaries. This works better at small grain sizes because the area of grain boundary is large.
The constitutive law for Coble creep is also viscous or Newtonian, but in this case the viscosity is proportional to the square of the grain size.
Also known as pressure solution
Rate depends on amount, pressure, and chemistry of fluid present. Leads to development of stylolites and pressure solution cleavage, more typical of regional metamorphism than of shear zones.
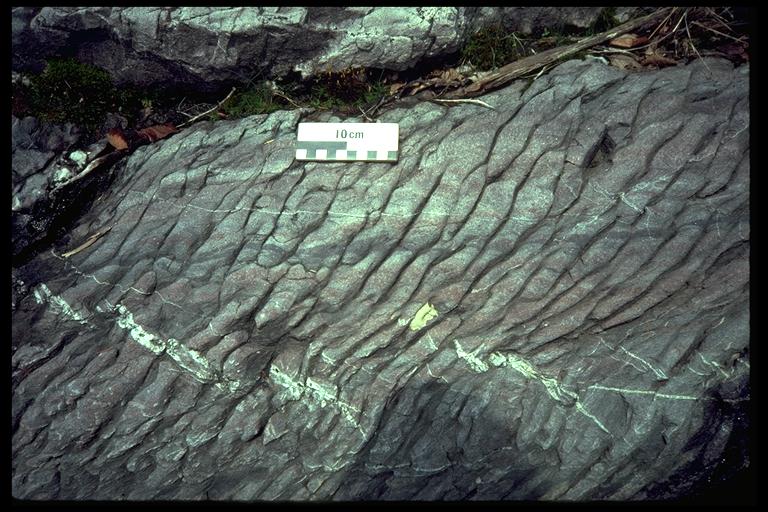
Photograph of pressure solution cleavage

Strain rates for pressure solution are typically highly dependent on chemical parameters and cannot easily be fitted into one of the constitutive laws for creep.
In some highly deformed materials, grains can move past each other as the material deforms, leaving behind a fine-grained aggregate that does not show strong CPO. How does this happen? It seems that corners and other irregularities that would normally prevent grain-boundary-sliding can be diffused out of the way- the crystals remould themselves to allow grains to slide past each other. This phenomenon is called superplasticity. It's occurrence is a little controversial but it has been cited in some examples of fine grained rocks that appear to have sheared but which do not show the characteristic CPO of mylonites.
The flow law for superplasticity is viscous or Newtonian.
Many of the illustrations in this section are from an excellent series of lecture notes posted by M Jessell, P Bons & P Rey 2002 at Microstructures Online http://www.earth.monash.edu.au/Teaching/mscourse/
Dislocation glide is the fundamental process of deformation at high strain rates, by which mylonites flow
The constitutive law for dislocation glide is typically exponential creep.
Dislocation glide leads to huge densities of dislocations within crystals. Eventually leads to strain hardening because the dislocations get tangled - they need good, intact crystal to migrate, and so are held up by other dislocations.
Deformed quartz crossed polars
However, at slower strain rates and/or higher temperatures, there are other processes involving diffusion that can assist with dislocation motion.
Deformation involving a combination of diffusion with dislocation glide are known as dislocation creep. In metallurgy, diffusion-assisted reorganization of dislocations is known as recovery.
Several processes are involved in dislocation creep and recovery:
Dislocation creep typically follows a power law relationship in which strain is proportional to stress raised to some power between 1 and 5, typically around 3
Notice that the crystal lattice is distorted in the vicinity of a dislocation wherever one occurs. This results in availability of energy to break bonds, and thus there is a tendency for a crystal containing a lot of dislocations to rebuild itself into numerous small crystals. This is the process of dynamic recrystallization that produces mylonite.
Recrystallization in experimental polycarbonate.
Dynamic recrystallization produces a strong crystal preferred orientation (CPO) or lattice preferred orientation (LPO).
Stereographic projection of quartz C-axes from mylonite.

Movie of grain boundary migration
For most of these types of deformation it's now possible to determine a theoretical relationship between stress and strain, based on knowledge of the kinetic behaviour of atoms at various temperatures, and on the bond strengths for different types of bonds (from mineral chemistry).
Hence we can determine which mechanism gives the fastest strain rate at a given set of conditions (temperature and differential stress).
This leads to the idea of a deformation map - typically a plot with temperature and differential stress on the axes, divided into areas according to which mechanism is fastest. Here are some deformation maps for common minerals.
(Davis & Reynolds Fig. 4.61)


These maps show the fastest deformation mechanism under given conditions of T and differential stress. Contours are drawn within the diagrams showing the strain rate predicted under those given conditions. (Note: the lines are numbered with the log of the strain rate: where it says '-9' this means 10-9).
In general, only the highest strain rates can be experimentally verified: the lower strain-rate parts of the diagram are predicted based on chemically determined diffusion constants and bond strengths.
We can use these diagrams to make predictions about the strength of the lithosphere at various depths, by assuming a geothermal gradient (rate of temperature increase with depth).
In order to do this we have to bring brittle deformation into the picture. Brittle deformation is strongly dependent on pressure. The Mohr-Coulomb failure relationship or 'Byerlee's Law' allows us to predict the increasing differential stress required for fracture with increasing pressure. Hence the strength depth relationship shows an initial more or less linear increase of strength with depth.
(The relationship is a little different depending on whether the lithosphere is being extended or shortened. In general if the maximum compressive stress is vertical, a rather lower differential stress is required than if the maximum compressive stress is horizontal. This follows from the Mohr construction for brittle failure.)
Diagram
At some depth, the brittle deformation curve intersects one the strength-depth curve for one of the ductile mechanisms. This point marks the brittle-ductile transistion. Below this point, ductile flow requires less differential stress than fracture, so rocks flow.

If we are going to make deductions about the strength of the lithosphere we need to assume some compositions: in the following diagram we assume that quartz is the strength controlling-mineral in the crust, and that olivine controls strength in the mantle. For an average continental geothermal gradient this predicts a strong mid-upper crust, a weak lower crust, and a strong upper mantle.

We can use somewhat more sophisticated models. The diagram below shows strength profiles for a crust that has a wet-quartz-dominated 'granitic' upper layer, a dry-quartz-dominated mid crust, a feldspar-dominated 'granulite' lower crustal layer, and an olivine-dominated peridotite lithospheric mantle.

In the lower part of the diagram is a drawing based on a seismic cross-section of part of a rift zone on the Atlantic margin in NW Scotland. It shows the variation in structural style based on the inferred strength distribution. In the west (left) heat flow is low, so geothermal gradients are low. Fault-like behaviour is seen to great depth (note that the deformation map tells us that below a few km the 'faults' must be shear zones). In the east, heat-flow is higher, the crust is softer, and 'faults' extend to shallow depth only.