In this section we will look at the most highly strained rocks in the lithosphere - those found in shear zones.
Shear zones, also sometimes called ductile faults, are intensely strained zones that separate less severely deformed units.
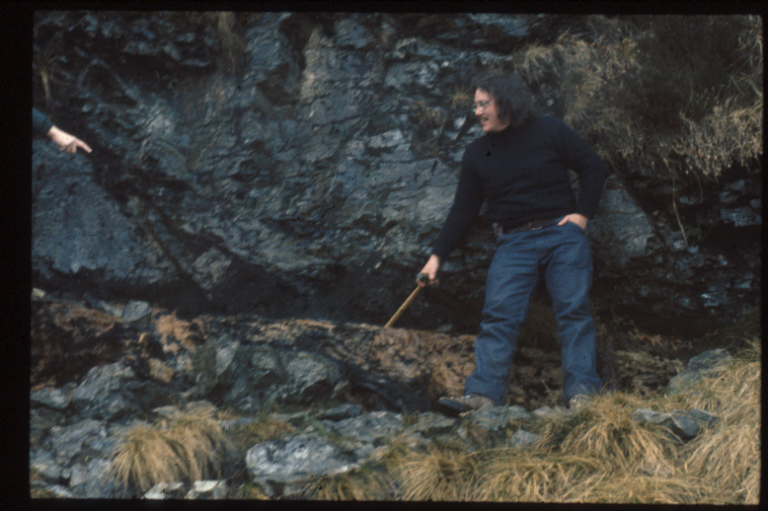
Where do shear zones occur (some examples)
Shear zones - especially in the shield - are the locus of large amounts of mineralization, eg Hemlo Gold deposit.
A characteristic rock type:- mylonite. Characterized by extreme grain-size reduction. Originally it was thought that this occurred through brittle grinding (the word mylonite refers to milling of flour). We now understand that the grain size reduction is the result of recrystallization, promoted by strain-induced crystal defects.
Because of their fault-like overall kinematics, the most obvious strain model for a shear zone is simple shear parallel to the boundary.
This allows the boundary of the shear zone to maintain its length, and therefore to maintain compatibility with adjacent less-strained rock units.
The simple shear may be heterogeneous, provided the shear plane is parallel throughout.
However, more complex kinematic schemes are possible, but they typically involve either departures from plane strain or volume change. We will consider mostly the simple shear case, but bear in mind that it's an idealized version.
To understand what goes on, we need to look a little more closely at simple shear, and at the distinction between finite and infinitesimal strain.
Consider a rectangular block that undergoes an "infinitesimal" simple shear through a small angle δψ
The infinitesimal strain ellipse is oriented so that S1 and S3 are at 45° to the shear zone boundary.

Like any deformation we can break it down into a pure strain (distortion only) and a rotation.
In this case the deformation is broken down into equal amounts of distortion and rotation.
What do we mean by that?
We can explain simple shear by superimposed infinitesimal increments of distortion (pure strain) and rotation.
The ratio between the rotation and the pure strain is called the vorticity of the deformation.
Vorticity has an effect on the behaviour of the strain axes
We are now in a position to think about what happens when we add up all the tiny increments of distortion and rotation that make up a progressive pure shear.
Consider what happens to a vein that opens up in a shear zone in response to high fluid pressure.

Example of shear zone with veins and stylolites
With this framework in mind we can begin to explain some of the various fabrics in shear zones. These fabrics are classified based on their relationship to finite and infinitesimal strain.
Strain sensitive fabrics rotate with the finite strain. Examples include stretching lineations, and foliations defined by flattened objects.
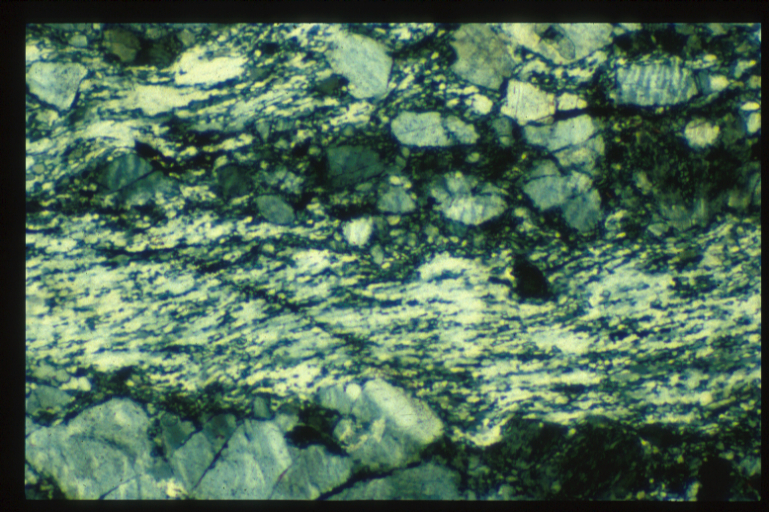
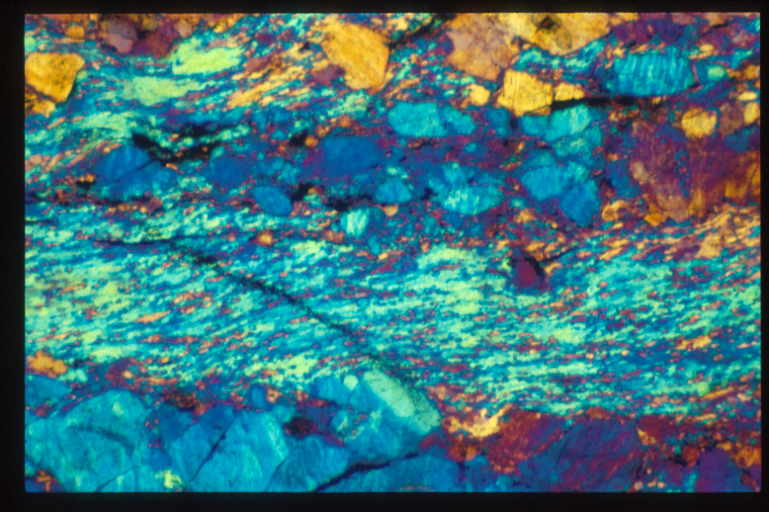
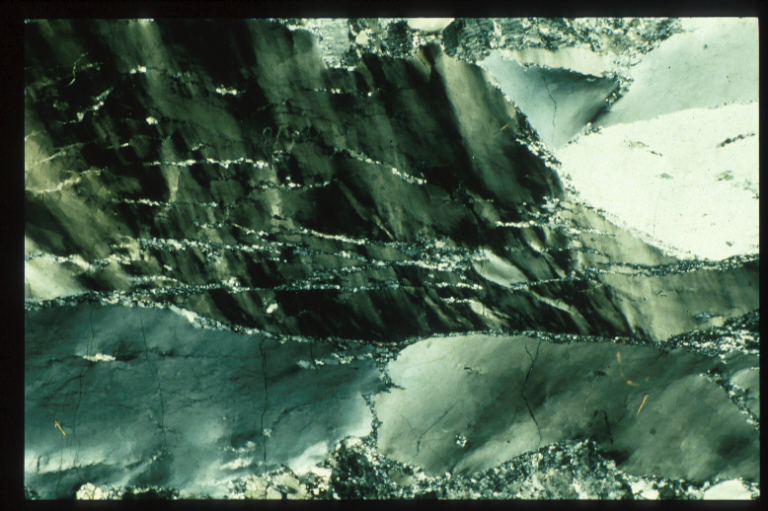
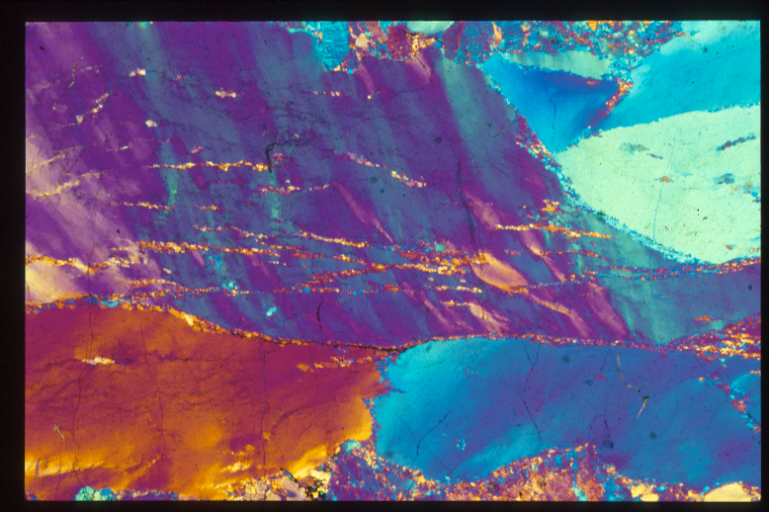
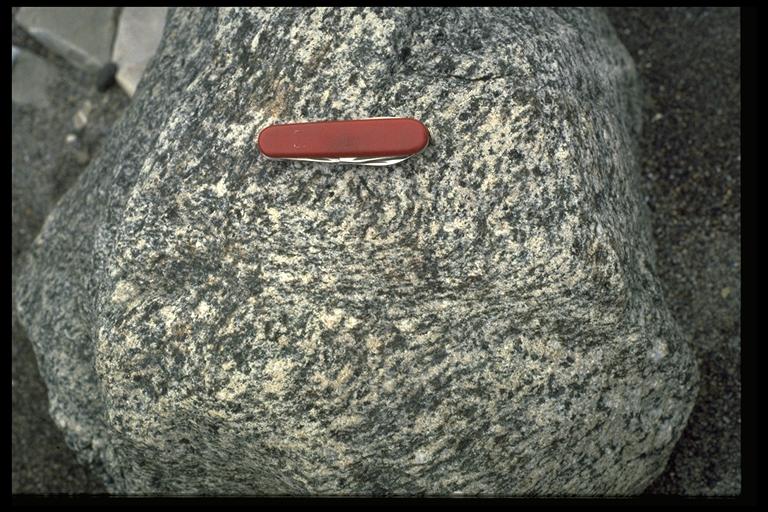 Shear zone in gabbro, with fabric defined by distorted feldspar and ferromagnesian aggregates.
Under the microscope, many rocks in shear zones show microscopic oblique foliation (accessory plate) - crystal long axes at about 45° to the shear zone, that seems to keep this orientation despite variations in finite strain.
This shows that the minerals must continuously recrystallize so as to stay aligned close to the infinitesimal strain axes.
Shear zones are commonly not homogeneously strained, and may show heterogeneities at small scale - often a scale comparable to the crystals of the original rock.
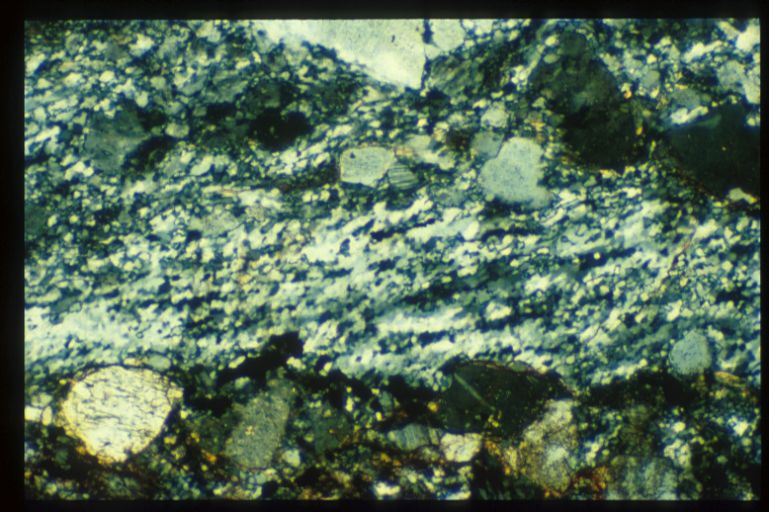
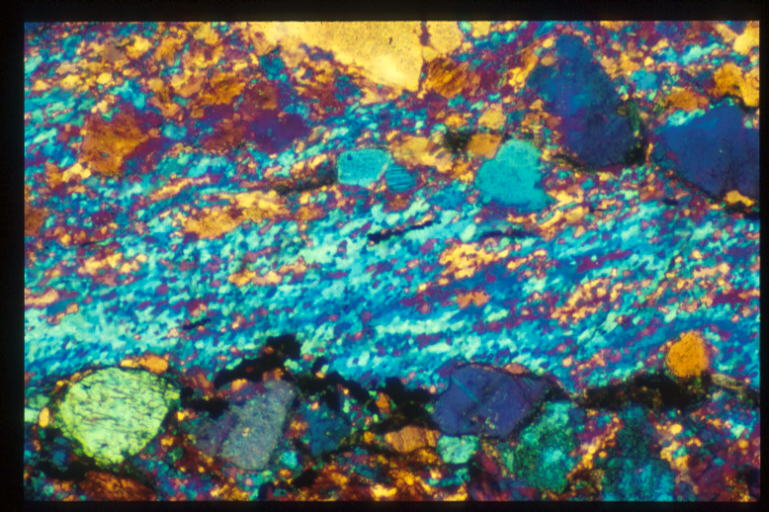
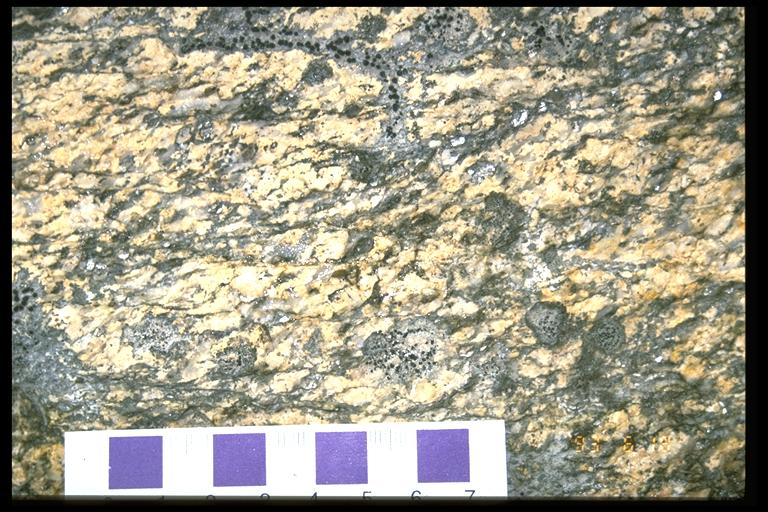 Granite protomylonite showing CS fabric
Heterogeneities in the angle of shear lead to the development of small intensely sheared zones, called C-planes if they are parallel to the shear zone boundary, or called extensional crenulation if they are inclined so that they extend the foliations. Intervening zones that have smaller amounts of strain are characterized by foliation that is highly oblique to the SZB, known as S-foliation. The combination of C and S planes is one of the most widespread indications of shear sense.
It is also common to see partitioning of the rotational and non-rotational parts of the strain, particularly when there are resistant, equant mineral grains which can roll more easily than they are distorted. These grains tend to focus vorticity, producing delta structures and or textures.

Delta structure experimentally generated in analogue materials. (Movie)
Another example of helicitic garnet 
It's possible to calculate bond strengths in crystals from chemical data. In most cases, the strengths indicate that it's impossible, with geologically reasonable stresses, to simultaneously break all the bonds in a crystal, so as to (for example) shear the crystal.
Nevertheless, we see clear evidence for shearing of crystals in deformed rocks.
It turns out that crystal defects - departures from the ideal lattice structure - are critically important in allowing crystals to deform.
Many of the illustrations in this section are from an excellent series of lecture notes posted by M Jessell, P Bons & P Rey 2002 at Microstructures Online http://www.earth.monash.edu.au/Teaching/mscourse/
 http://www.earth.monash.edu.au/Teaching/mscourse/
Point defects include:
Point defects can move through crystals by diffusion (random motion of atoms). Vacancies are particularly important in allowing diffusion to take place
Animation of vacancy diffusion.
Line defects where there is a non-standard linking of atoms are also known as dislocations.
 Diagram of edge dislocation (www.crystalmaker.com)
Large numbers of dislocations produce a curved crystal lattice

This shows up in thin section as undulose extinction
In practice, a given dislocation can change orientation from parallel to perpendicular to b, and all orientations in between.
 Dislocations in a crystal under TEM
The nature of the defect is defined by theBurger's vector b.
To define the Burger's vector, describe a closed loop in an undeformed section of crystal. Then follow a similar loop around the dislocation; the gap between the start and end point is the Burger's vector b.
An edge dislocation has b perpendicular to the dislocation line. It marks the edge of an extra half-plane of atoms.
 A screw dislocation has b parallel to the dislocation line. Atoms are connected in a helix ("spiral staircase") around the screw dislocation.
 Typically, across a twin plane, the structure of a crystal is reflected. (Rotations are also possible). Calcite and plagioclase feldspar are two minerals that typically show abundant twin planes.
Subgrain boundaries are surfaces across which the crystal lattice undergoes a subtle change in orientation.
Movie showing subgrain development
They are often visible under crossed polars in grains that show undulose extinction.
A subgrain boundary is equivalent to a dislocation wall.

Stacking faults are planar sufaces across which unit cells are built ('stacked') in an order that does not match that of the perfect crystal.
Microcracks are important in the initiation of brittle deformation, because their ends are regions of stress concentration that can nucleate faults.
Many of the illustrations in this section are from an excellent series of lecture notes posted by M Jessell, P Bons & P Rey 2002 at Microstructures Online http://www.earth.monash.edu.au/Teaching/mscourse/
Dislocation glide is the fundamental process of deformation at high strain rates, by which mylonites flow
Dislocation glide leads to huge densities of dislocations within crystals. Eventually leads to strain hardening because the dislocations get tangled - they need good, intact crystal to migrate, and so are held up by other dislocations.
However, at slower strain rates and/or higher temperatures, there are other processes involving diffusion that can assist with dislocation motion. Combinations of diffusion with dislocation glide are known as dislocation creep. Dislocation creep is one process that contributes to what is known as recovery - the removal of strain from within crystals by reorganization of dislocations.
(from www.scienceprof.com)
Another process of recovery is the migration of dislocations into dislocation walls, which appear in thin-section as sub-grain boundaries.
Notice that the crystal lattice is distorted in the vicinity of a dislocation wherever one occurs. This results in availability of energy to break bonds, and thus there is a tendency for a crystal containing a lot of dislocations to rebuild itself into numerous small crystals. This is the process of dynamic recrystallization that produces mylonite.
Recrystallization in experimental polycarbonate.
Dynamic recrystallization produces a strong crystal preferred orientation (CPO) or lattice preferred orientation (LPO).
Stereographic projection of quartz C-axes from mylonite.

Also known as volume diffusion - crystal changes shape by migration of point defects - particularly vacancies - through the crystal.
Also known as grain boundary diffusion
Crystal changes shape by migration of atoms along grain boundaries. This works better at small grain sizes because the area of grain boundary is large.
Also known as pressure solution
Rate depends on amount, pressure, and chemistry of fluid present. Leads to development of stylolites and pressure solution cleavage, more typical of regional metamorphism than of shear zones.
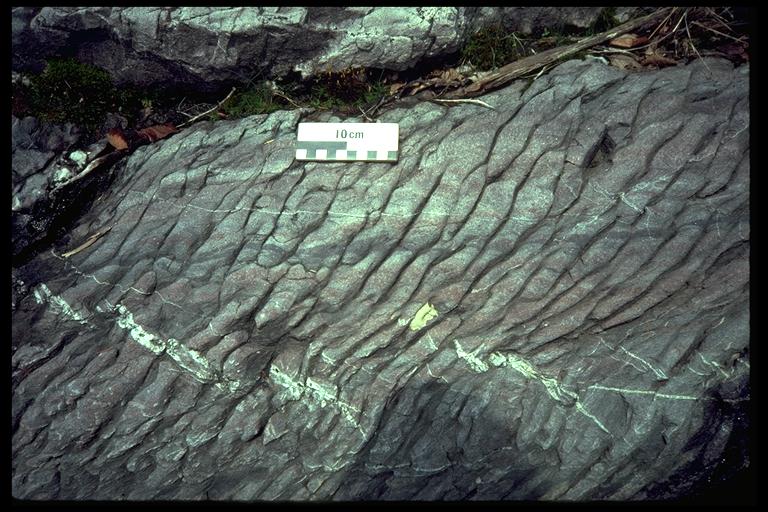
Photograph of pressure solution cleavage

In some highly deformed materials, grains can move past each other as the material deforms, leaving behind a fine-grained aggregate that does not show strong CPO. How does this happen? It seems that corners and other irregularities that would normally prevent grain-boundary-sliding can be diffused out of the way- the crystals remould themselves to allow grains to slide past each other. This phenomenon is called superplasticity. It's occurrence is a little controversial but it has been cited in some examples of fine grained rocks that appear to have sheared but which do not show the characteristic CPO of mylonites.
Movie of grain boundary migration
For most of these types of deformation it's now possible to determine a theoretical relationship between stress and strain, based on knowledge of the kinetic behaviour of atoms at various temperatures, and on the bond strengths for different types of bonds (from mineral chemistry).
Hence we can determine which mechanism gives the fastest strain rate at a given set of conditions (temperature and differential stress).
This leads to the idea of a deformation map - typically a plot with temperature and differential stress on the axes, divided into areas according to which mechanism is fastest. Here are some deformation maps for common minerals.
(Davis & Reynolds Fig. 4.61)


These maps show the fastest deformation mechanism under given conditions of T and differential stress. Contours are drawn within the diagrams showing the strain rate predicted under those given conditions. (Note: the lines are numbered with the log of the strain rate: where it says '-9' this means 10-9).
In general, only the highest strain rates can be experimentally verified: the lower strain-rate parts of the diagram are predicted based on chemically determined diffusion constants and bond strengths.
We can use these diagrams to make predictions about the strength of the lithosphere at various depths, by assuming a geothermal gradient (rate of temperature increase with depth).
In order to do this we have to bring brittle deformation into the picture. Brittle deformation is strongly dependent on pressure. The Mohr-Coulomb failure relationship or 'Byerlee's Law' allows us to predict the increasing differential stress required for fracture with increasing pressure. Hence the strength depth relationship shows an initial more or less linear increase of strength with depth.
(The relationship is a little different depending on whether the lithosphere is being extended or shortened. In general if the maximum compressive stress is vertical, a rather lower differential stress is required than if the maximum compressive stress is horizontal. This follows from the Mohr construction for brittle failure.)
Diagram
At some depth, the brittle deformation curve intersects one the strength-depth curve for one of the ductile mechanisms. This point marks the brittle-ductile transistion. Below this point, ductile flow requires less differential stress than fracture, so rocks flow.

If we are going to make deductions about the strength of the lithosphere we need to assume some compositions: in the following diagram we assume that quartz is the strength controlling-mineral in the crust, and that olivine controls strength in the mantle. For an average continental geothermal gradient this predicts a strong mid-upper crust, a weak lower crust, and a strong upper mantle.

We can use somewhat more sophisticated models. The diagram below shows strength profiles for a crust that has a wet-quartz-dominated 'granitic' upper layer, a dry-quartz-dominated mid crust, a feldspar-dominated 'granulite' lower crustal layer, and an olivine-dominated peridotite lithospheric mantle.

In the lower part of the diagram is a drawing based on a seismic cross-section of part of a rift zone on the Atlantic margin in NW Scotland. It shows the variation in structural style based on the inferred strength distribution. In the west (left) heat flow is low, so geothermal gradients are low. Fault-like behaviour is seen to great depth (note that the deformation map tells us that below a few km the 'faults' must be shear zones). In the east, heat-flow is higher, the crust is softer, and 'faults' extend to shallow depth only.