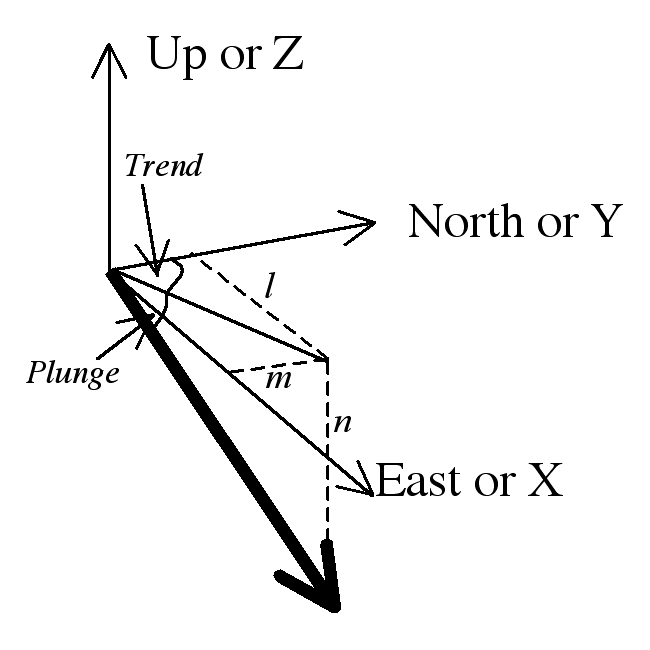
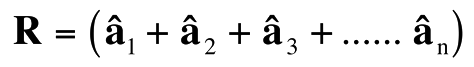
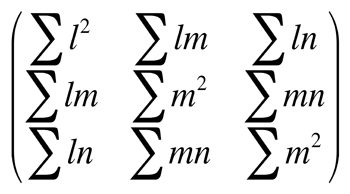
The the vector components (l,m,n) of a line with plunge (P) and trend (T) are given by:
The three components are called direction cosines because each is the cosine of the angle between the line and an axis.Planes as vectors: plane normalsTo do the same kinds of things with planes, we use the normal or pole to the plane. |
||||
Point plot vs Contour plot |
||||
Contour plot: 1% circle method | |||||
Contour plot: Starkey method |
|||||
Contour plot: Gaussian method, single point |
|||||
Gaussian plot |
||||
Vector sum |
|||||||
Resultant R = |R| |
|||||||
Vector mean |
|||||||
Mean resultant r = R/n |
|||||||
Critical Values for the Rayleigh test of uniformity
Cone of Confidence on the mean direction |
||||
38 fold hinges from Stellarton NS |
|||||||
Direction cosine matrix |
|||||||
The direction cosine matrix yields 3 eigenvectors. (Analogous to strain axes for a non-rotational deformation matrix.)Associated with each is an eigenvalueE1 = 0.46 E2 = 7.11 E3 = 29.42The relative sizes of the eigenvalues indicate the strength of clustering about each eigenvector |
|||
The modified Flynn plot indicates the relative magnitudes of the 3 eigenvectors |
|||||