|
|
|
The the vector components (l,m,n) of a line with plunge (P) and trend (T) are given by:
The three components are called direction cosines because each is the cosine of the angle between the line and an axis.
Planes as vectors: plane normals
To do the same kinds of things with planes, we use the normal or pole to the plane.
|
|
 |
|
|
|
|
|
|
|
|
|
 |
 |
|
Point plot vs Contour plot
|
|
|
|
|
|
|
|
|
|
|
|
|
 |
|
|
Contour plot: 1% circle method |
|
|
|
|
|
|
|
|
|
|
|
|
|
 |
|
|
Contour plot: Starkey method
|
|
|
|
|
|
|
|
|
|
|
|
|
|
 |
|
|
|
Contour plot: Gaussian method, single point
|
|
|
|
|
|
|
|
|
|
|
|
|
|
|
|
Gaussian plot
|
|
|
|
|
|
|
|
|
|
 |
Vector sum
|
|
|
 |
|
|
Resultant R = |R|
|
|
|
Vector mean
|
|
 |
|
|
Mean resultant r = R/n
|
|
|
|
|
|
|
|
|
|
|
Critical Values for the Rayleigh test of uniformity
|
|
|
 |
Cone of Confidence on the mean direction
|
|
|
|
|
|
|
|
|
|
|
 |
38 fold hinges from Stellarton NS
|
|
|
|
 |
|
|
|
Direction cosine matrix
|
|
|
|
|
|
|
|
|
|
 |
|
|
|
|
|
The direction cosine matrix yields 3 eigenvectors. (Analogous to strain axes for a non-rotational deformation matrix.)
Associated with each is an eigenvalue
E1 = 0.46 E2 = 7.11 E3 = 29.42
The relative sizes of the eigenvalues indicate the strength of clustering about each eigenvector
|
|
|
|
|
|
|
|
|
 |
The modified Flynn plot indicates the relative magnitudes of the 3 eigenvectors
|
|
|
|
 |
|
|
|
|
|
|
|
 |
|
| http://www-texdev.mpce.mq.edu.au/GeoMath/ |
|
|
|
|
|
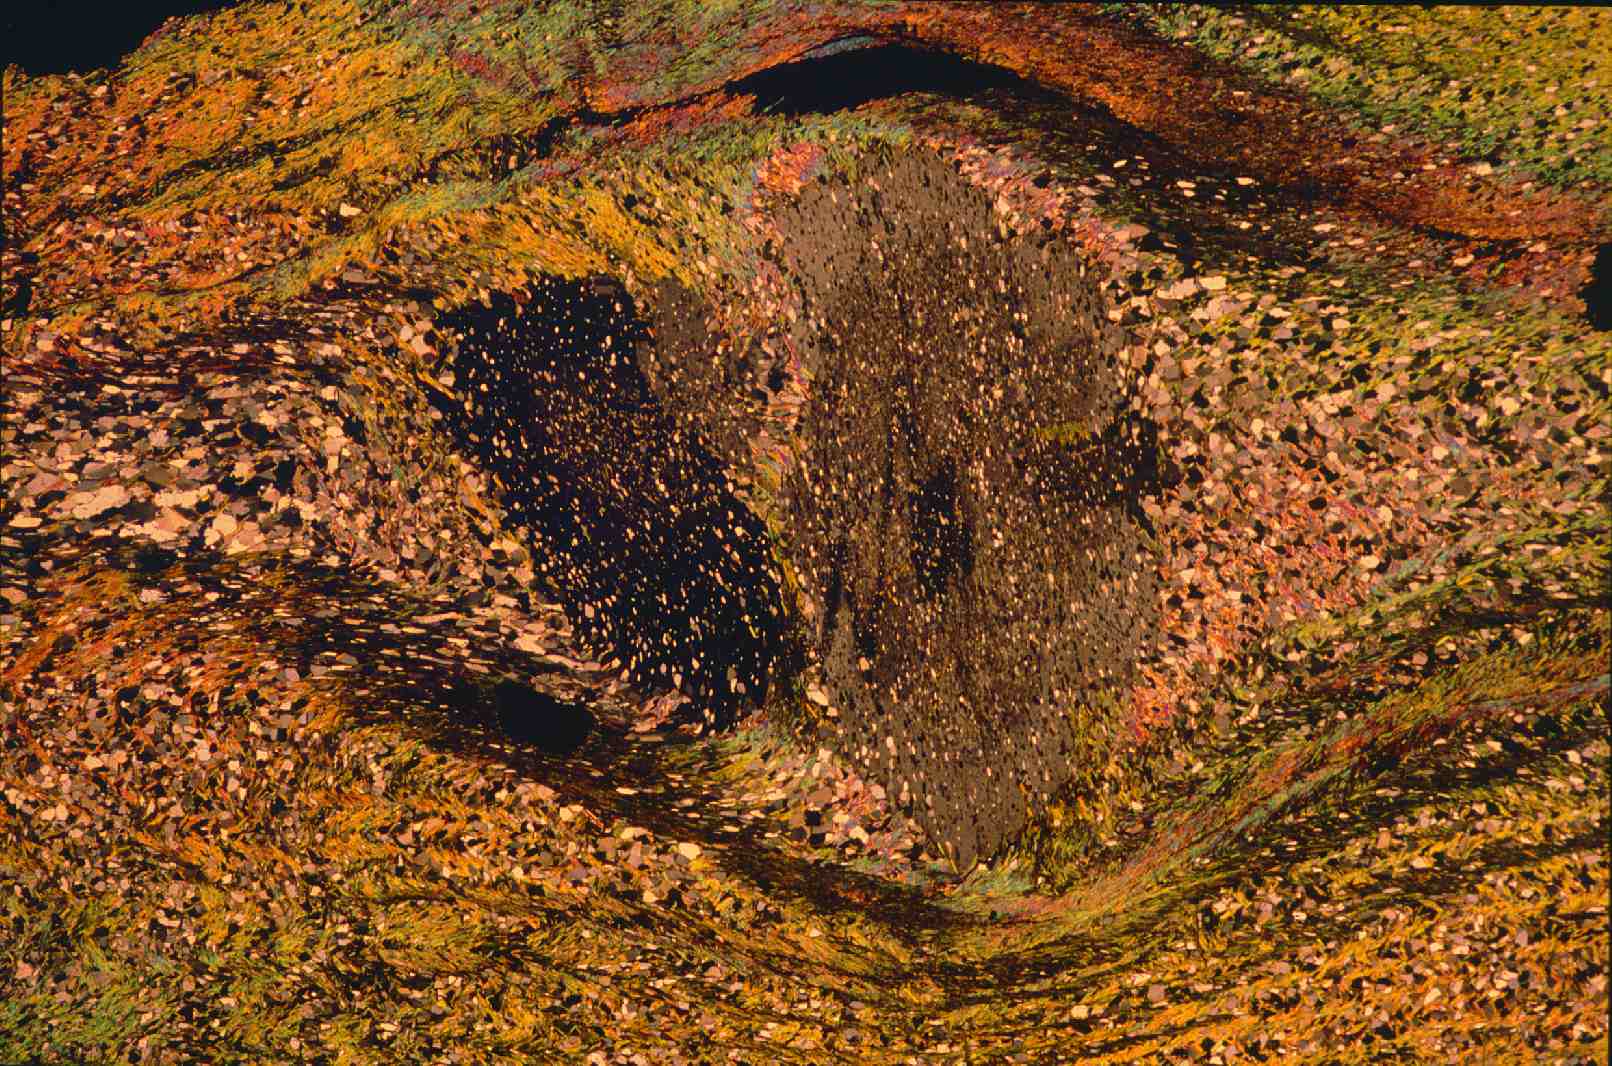
Diagrams showing fabrics developed by deformation of random populations of passive markers. Ramsay, J. G., and Huber, M. I., 1983, The Techniques of Modern Structural Geology. Volume 12: Folds and Fractures. Academic Press. Reproduced under license from Cancopy; further reproduction prohibited


