Rifts are often described as extension zones. By now we know enough about strain to realize that almost all strains involve extension in some direction or other. By 'extension' we here mean that S1 is ~ horizontal and S3 is ~ vertical.
In many rifts it seems that movement is roughly perpendicular to the rift axis, and we can therefore assume plane strain.
Note that this is not necessarily the case. When rifting is oblique then plane strain does not apply: we refer to the strain in an oblique rift as transtension
Many common configurations of normal faults are variations on the theme of conjugate faults: multiple normal faults in 2 families, with ~60° angle between them.
We explain these dynamically as shear fractures resulting from critical stress for brittle failure (the Mohr-Coulomb failure model), which can also be replicated in experiments.
Where there are multilayered rocks, with any kind of anisotropy, its common for faults to shallow in the incompetent or highly anisotropic rocks, producing ramp-flat geometries analogous to those in thrusts.
In general, there is also a tendency for normal faults to flatten into shear zones at depth, producing listric geometries, though the extent of flattening in indifidual rifts may be controversial. The brittle-ductile transition is poorly imaged in most seismic profiles. Contrasting models may be possible for different rifts if deeper parts of profile are not visible.
![]()

A number of strategies can be used to measure total extension in rift zones. However, most depend in some degree on assumptions about the strain and kinematic style.
Diagram of differnt assumed styles VDPM 16.05
Diagram to show extension calculations
For non-tilting blocks, the simple assumption is often made that the extension is the sum of the fault heaves
However, tilting blocks make the calculation more complicated
If there is significant strain in fault blocks, this can become more complex still.
 The most influential example in the present-day world is the East African Rift, which shows the follwing features:
Map of African Rift VDPM 16.01a
Gravity profile through East African Rift
Diagram of lithosphere before VDPM 16.04a and after rifting VDPM 16.04b
In detail, the rift valley is characterised by active fault scarps separating blocks that are typically tilted toward adjacent faults.
At shallow depths, fault planes may be marked by products of cataclastic flow by brittle fracture. These products include
Importantly in oil-field studies, gouge is typically sealing, whereas breccia and cataclasite are permeable. In the North Sea, oil companies working with sandstone and shale successions have had some success predicting fault permeability using gouge ratios. The gouge ratio at a point on the fault plane is obtained by looking at the stratigraphy between the rocks exposed in the footwall and the rocks exposed in the adjacent hangingwall. The gouge ratio is the ratio of shale to total thickness in this succession. Gouge ratios above ~30% tend to be sealing.
At greater depths, ductile normal faults are marked by
Core complexes typically expose mylonitic rock in the lower plate, cataclasite, breccia, or gouge in the upper plate.
Sometimes offset layers appear deflected by simple shear with the same sense as a fault, producing a simple fold. Such folds have long been called drag folds, because of the appearance that movement on the fault has dragged the layers. Although this may be the mechanism of formation in very loosely consolidated rocks, it is likely in many cases that the fold pre-dated the fault. Hence these so-called drag folds are actually the extensional equivalent of fault-propagation folds in thrust belts.
Photo of drag fold 
Folds showing the opposite kinematics to drag folds are common adjacent to normal faults. This phenomenon used to be referred to as 'reverse drag' but is now commonly known as 'rollover'.
Rollover is a variety of fault-bend folding. To see how rollover works, consider a normal fault with concave-up and convex-up segments. To maintain strain compatibilty, the hanging wall must deform to accomodate changes of shape in the footwall.
VDPM 16.07 strain compatibility
VDPM 16.08 rollover

Note that flats in this geometry tend to be overlain by anticlines and the ramps by synclines.
 Rollover folds with associated extensional faults, Stellarton NS
Fault-bend folds related to listric normal faults are very important as petroleum traps in a number of fields on passive margins, including both margins of the Atlantic. Several big fields including Hibernia have this general geometry.
Seismic sections of Hibernia structure 

A significant amount of attention has been paid to relating the shape of rollover structures to the shapes of faults.
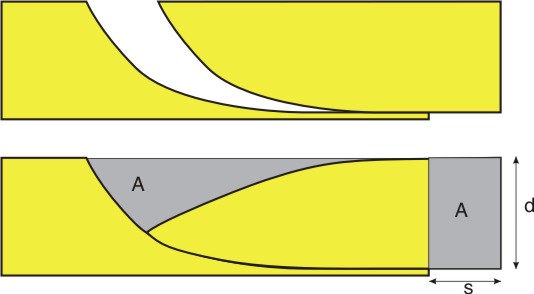
We can examine the relationship between slip, shape of the fault, and shape of the rollover.
For a fault that flattens at depth, a basic balancing relationship in which we assume plane strain shows that if the area of subsidence over the hangingwall is A, then A=slip x depth to detachment.
A section is said to be balanced if it can be restored to a pre-deformation state (retro-deformed), under the assumption of
However this does not tell us about the relationship between the shape of the subsided area and the curvature of the fault .
The relationship depends on the type of strain developed in the hangingwall as it accommodates to the footwall.
The simplest assumption is of vertical simple shear.
If the horizontal component of displacement is h (for heave) then we can make a construction called the Chevron construction, that enables us to predict the fault trace from the bedding trace or vice versa.
For example, given this geometry...
![]()
The lengths t1 t2 t3... can be used to reconstruct the thickness of the hanging wall and thus fix the shape of the fault.
![]()
Other possible modles include simple shear on some other plane: e.g. a conjugate plane to the main fault.
In practice, the hangingwall of most large listric normal faults is deformed by a combination of folding and faulting
In homogeneous rocks subjected to stress in the brittle domain, fractures initiate at points of slightly elevated shear stress or slightly lower strength rock. At low bulk strains, the faults do not join up and we observe isolated fractures that terminate at a generally elliptical tip line.
Tip lines VDPM8.14a


In map view these faults show decreasing heave towards fault tips at either end. (Heave is the horizontal component of the fault offset.)
In general, the width (distance between tip points) of a fault trace increases as displacement increases. Some theoretical studies predict displacement proportional to the square of the width, but statistical studies from known faults show more like (slip) ∝ (width)1.06.
As bulk strain increases, faults join up into arrays (like thrust faults) at branch lines.
Faults may show ramps and flats due to differences in lithology. Extended flats are generally known as detachments.
Where listric faults sole into a detachment, it is common to find that higher normal faults formed first, and that deformation propagated in a direction opposite to the motion of the hanging wall. VDPM 16.05
Large parts of the rift valley are asymmetric, a dominant dip of faults either E or W, and an overall half-graben geometry.
In plan view the symmetry switches periodically.
Block diagram showing switches in rift asymmetry
Regions with opposing asymmetry are separated by transfer zones.
Though some rift segments appear much more symmetric


Some examples of ancient rifts (both are failed parts of the rift system that led to formation of North Atlantic):
Fundy rift, an ancient asymmetyric rift: 
North sea rift - part of a major petroleum producing province
Ancient rift zones like the N. Sea probably contain about 30% of the world's giant oilfields
Passive continental margins are margins of continents that do not coincide with a plate boundary. A pair of passive continental margins forms when rifting gives way to ocean-floor spreading. Passive margins are also called 'rifted margins' or 'Atlantic-type margins'
Diagram of the rift system that led to the formation of Atlantic continental margins

Passive continental margins are rift remnants, left behind when sea-floor spreading starts.
Diagrams showing evolution from rift to passive margin
Alternative version based on Red Sea: 
Passive continental magins characteristically subside because the heat source is removed to the new spreading centre.
Characteristically, passive margins show:


If we look at subsidence history, as measured by the accumulation of sediments, there is typically an initial rapid phase of subsidence (rift phase) followed by a period in which the subsidence curve is exponential, with gradually slowing subsidence.
In a general way, it's possible to predict the cooling rate (and therefore the subsidence rate) associated with a given amount of crustal thinning. Hence it's possible to take a subsidence curve and calculate how much the crust must have been extended. (Subject to assumptions about the temperature of the upper mantle.)
In addition to the 30% of the world's giant oilfields that are contained in rifts, passive margin post-rift successions contain about another 30%; thus 60% or more of the world's oil is located in rifts and passive margins.
Rifts in tropical climates may accumulate thick evaporite deposits. As spreading occurs, these evaporites may undergo mobilization within the passive margin succession. Salt structures are introduced in Ch 2 of VDPM's text.
Halokinesis refers to the movement of salt.
Halokinesis is typically due to:
Most evaporite minerals are weaker than silicate minerals. In addition, halite has a density (2200 kg/m3) that is much less than most compacted sedimentary rocks (typically 2500 kg/m3). In addition salt has little porosity when deposited. As it is buried it may actually expand a little due to heating with the geothermal gradient, so it gets less dense (slightly) with depth. In contrast, most clastic sediments increase in density during burial due to compation.
Hence, with burial, a stratigraphic section containing salt to reach
Differential loading occurs if there is a slighly heavier pile overlying one part of a salt layer. A pressure gradient is established so that salt flows away from that point.
These effects combine to produce a number of geometries
Salt withdrawal features VDPM 2.20
Geometric features of rising salt VDPM 2.18
Where salt reaches a point of neutral buoyancy it may spread within the stratigraphy to produce:
Map VDPM 16.27
Section VDPM 16.28
Some passive margins, with or without salt, show long distance (10s of km) gravity slides of large sediment sheets
Extensional faults are also notable within several orogens. This is true of the North American Cordillera, where a large area of the western US shows basin and range geomorphology defined by numerous normal faults. VDPM 16.12
Diagrams showing multiple intersecting normal faults 
It's clear that some faults formed in flat orientation, and outline large areas of deep-crustal metamorphic rocks from which the cover has been removed by a combination of tectonism and erosion - core complexes.
VDPM 16.13 cross-section of core complex
The faults surrounding core complexes are typically hybrid brittle-ductile structures, with fault breccia in the hanging wall and mylonite in the footwall.
These features suggest that these extensional zones are dominated by listric faults that flatten into a detachment close to the brittle-ductile transition.
In other parts of the orogen, including the southern Canadian Cordillera, there are core complexes that appear to be older equivalents of the basin and range.
Why core complexes? Several hypotheses have been suggested:
All these factors have affected the Cordillera -the abundance of extensional structures late in orogen history may be due to a combination of factors.
All rifts are associated with high heat flow. Thus it is clear that heat is important in the evolution of rifts. How does heating cause extension?
Following rifting, lithosphere typically cools and subsides. The rate of cooling (and therefore subsidence) is predictable based on the thermal conductivity of rocks, the coefficient of thermal expansion, and isostasy. It is possible to make an estimate of the stretching factor (beta) based on the subsequent subsidence history.
Subsidence curves for various beta
Unfortunately, for some major rifts, there is a mismatch between the stretching calculated from subsidence and the stretching calculated by adding all the fault heaves. This might be due to:
This is an area that needs further research